Skip to content

SmartMan

How artificial intelligence can change product ordering for eCommerce stores?

jiangxulei1990-eIzzzwtkBjU-unsplash

What is SmartMan Score?

Just as in physical stores the effectiveness of good Visual Merchandising management has been proven, in online stores it is equally important to be able to execute dynamic product ordering strategies quickly and efficiently.

SmartMan.AI connects to eCommerce stores and Google Analytics to work with the store’s sales and product behavior data over a 90-day period of time. From the analysis of variables such as:

  • Sales in units
  • Sales in value $
  • Price
  • Discount
  • Inventory
  • QInv (Quality of Inventory curve)
  • Date of creation
  • Brand
  • Product views in the PLP
  • Product visits – PDP
  • % Added to cart / Product visit
  • % Purchased / Product Visit
  • % Product Visit / Product View at PLP

SmartMan.AI generates a score for each product in each category in a comparative way to the products that are displayed in the same PLP, thus determining a ranking of recommendation of positioning of a product within a category or collection. The SmartMan Score is a value between 1 and 1,000, where the higher value means a higher recommendation to put the product in the first positions.

For example, in a sports store we can have a category called tennis / running, and in this category there can be 400 products. SmartMan.AI analyzes the 400 products and generates a SmartMan Score or score from 1 to 1,000 to all products within that category. The Score aims to maximize sales by giving higher value to products with higher probability of selling.

The result would look something like this:

In the first version of SmartMan.AI, the machine learning algorithm, whose objective is to maximize store sales, punished new products for not having a track record or sales history, and also did not allow configuring or balancing the score of each product with other objectives such as reducing inventory, better price, inventory quality or discount.

Balanced SmartMan Score

In the new version of the SmartMan.AI algorithm, the application allows the user to configure a balanced SmartMan Score, so that for each commercial strategy or store campaign, it can be modified to help achieve the objectives of the moment.

In this way a user can configure his store so that the SmartMan Score aims to maximize sales and at the same time highlight new products, for example. Also for discount season, it could give more weight to products with better discounts during the days of the promotion and then return to a model where it gives more weight to products with higher inventory.

With this balanced SmartMan Score configuration model, the application allows to quickly change the store ordering based on multiple objectives in a balanced way.

Variables

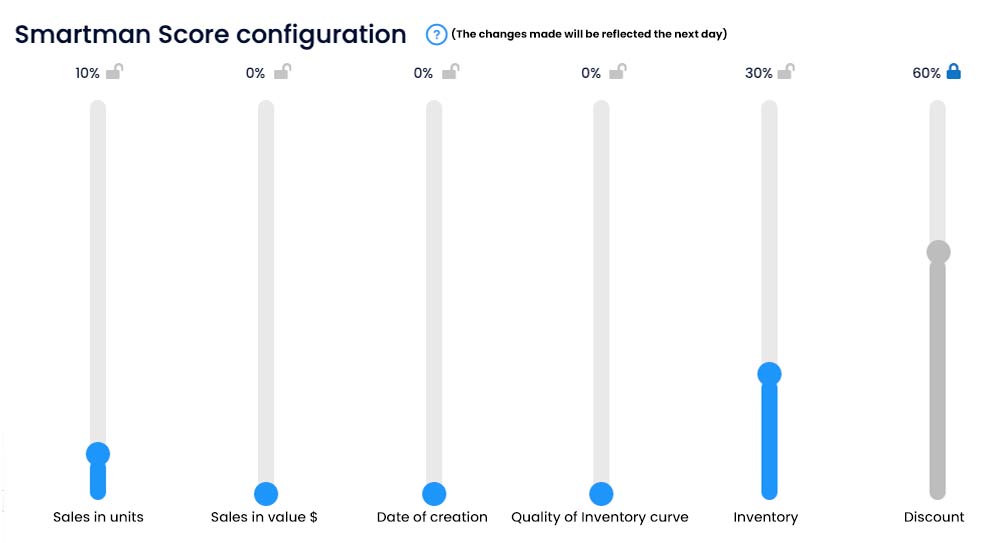
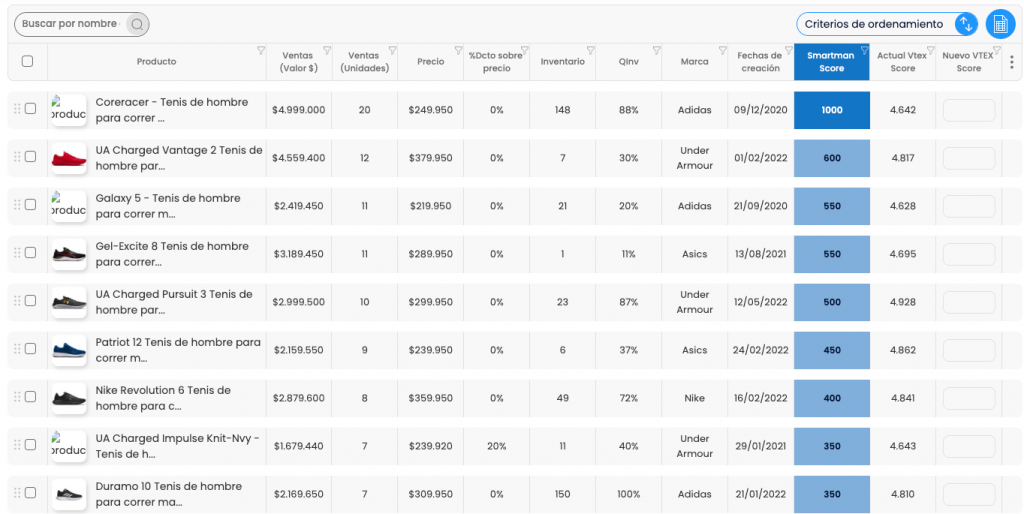
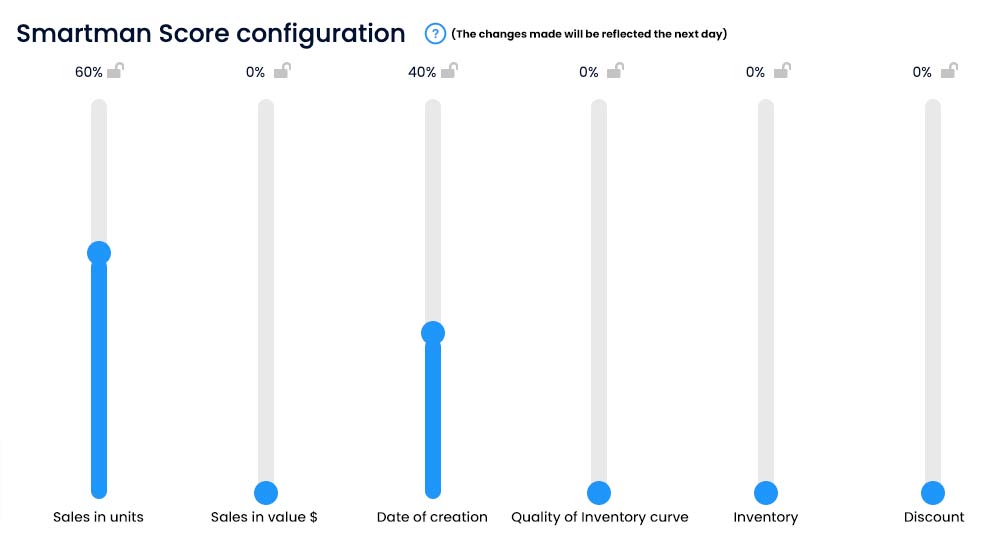
In the Balanced SmartMan Score, variables associated with sales are used such as Sales in Value and Sales in units, also used are the date of creation of the products, the Inventory and Quality of the inventory curve – QInv, and the discount that a product has. Let’s take a closer look at each of them.

Sales in Value: It is calculated based on the total sales value generated by the product.

Sales in Units: It is the number of units sold of the same product.

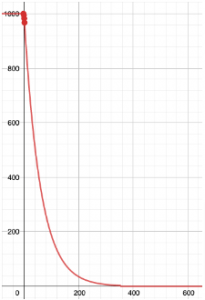
Date of creation: Assigns a higher score to products with a more recent launch date, using an inverse exponential curve so that this score decays rapidly over time.

Inventory: Assigns a proportional score comparatively to products in the same category.

Quality Inventory Curve (QInv): When a product has several versions of the product, same product but different size or color, something very common in the fashion sector, a higher score is assigned to products that have 100% availability in the different versions.

Discount: The greater the discount compared to the rest of the products in its category, the higher the value assigned to the discount variable.


Uses

When thinking about the ranking model, the Balanced SmartMan Score allows you to quickly assign positions according to the weights assigned to the selected variables.

Example: X fashion store

Discount season:

  • 60% discount
  • Inventory 30% off
  • Unit sales 10% off

At the end of the discount season, the new collection is launched.

  • Creation date 33%
  • Qinv – Inventory curve 33%
  • Sales 34%

Objective: to increase sales value with new products and good inventory curve.

Resultados que se ven

Organiza las vitrinas de producto de acuerdo a tus preferencias.

¿Quieres un demo o hablar con nuestro equipo de ventas?

Regístrate ya, para vivir la experiencia SmartMan